A story about Story Mapping

You can still create a story map in Miro using backlog stories in Jira without the tools being integrated. This is a step-by-step illustration guide on how to do it.

Image courtesy Planio.

Image courtesy Planio.

 
  1. Map the user journey

Image courtesy of Eva Shicker, ‘Journey-mapping pain points & success moments’

Image courtesy of Eva Shicker, ‘Journey-mapping pain points & success moments

First, plot your primary user’s journey map; how do you see your user achieve their task or meet their goal? what actions do they need to take? what’s the order of those actions?
The future or desired user journey will help you and product managers with user story writing.


2. Write stories in jira

Product owners should be able to write stories in the backlog in Jira based on the plotted user journey. Next, export the lot;

  • Click ‘Filters’ from the top main menu when in the backlog

  • Select your Project any other relevant filters is necessary (issue type, status etc..)

  • Hit ‘Search’

  • Click ‘Export’ at the top and choose ‘Export Excel CSV.’


3. the Post it wall

post it wall

Open the .csv in Excel or Google Sheets. Select the first column that contains the name of the user stories and copy/paste it into a board in Miro.

You’ll see the stories turn into Post It notes just like a budding flower!


4. prep for story mapping

Legend

Turn the Post It notes into cards using the ‘switch type’ option within the selected Post It note/s menu. (You can change up to 30 notes to card at once).

Turning notes to cards allows you to add more detail including, date, assignee and tags.

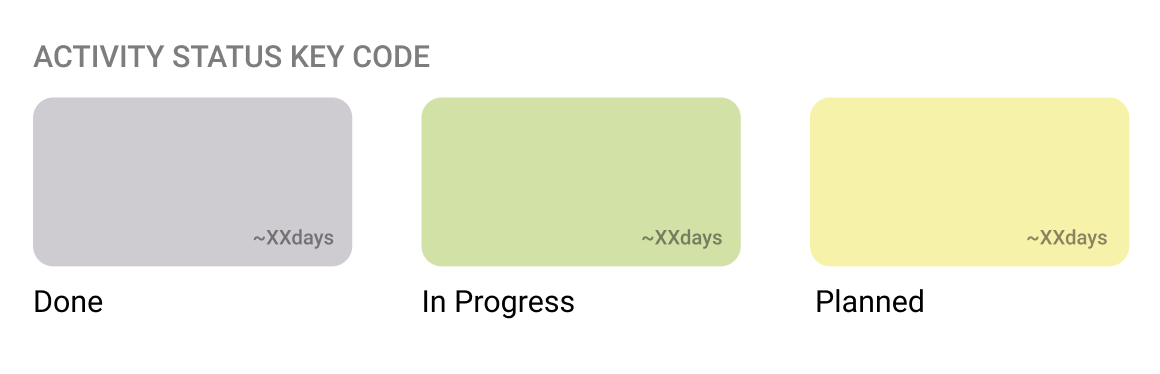
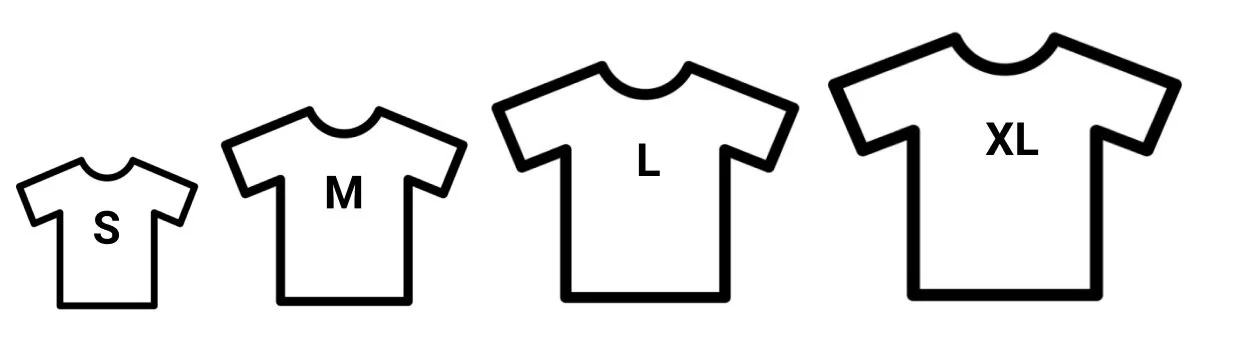
From the main left vertical menu in Miro, select ‘Template’ and choose the ‘User Story Map Framework.’ The framework is easy to use and provides you with a few examples of epics and releases. I suggest you create a legend so that all collaborators can understand what the various parts of the Framework represent.


5. creating the map

Diagram courtesy of Jory McKay of Planio, ‘A Guide to User Story Mapping

Start from the bottom by pooling users tasks that is, stories together that make most sense to accomplish a goal or ‘backbone’ as identified by the User Journey. Provide a name to the ‘activity’ or epic, just like you would in an open card sort.

Learn more about Story Mapping from the experts;


6. Update the backlog & keep the Map alive!

An example of a Story map. Click image for enlarged view.

Update the backlog with any missing or clarified stories from the mapping. Continue reviewing the Story Map periodically with new discoveries from research, discussion with the dev team and any changes to budgets and plans. Last but not Least, I recently discovered Easy Agile User Story Maps for Jira, a plugin which allows you to plot the map directly in Jira. Definitely worth considering!

Research Ops during and post lockdown

Some tips on carrying out research with working-from-home users and a survey template free for you to use.

DSC_0977-3.jpg

The sudden context switch from office to home has impacted employees around the globe. The shift to working from home threw our IT Support in a spree to enable the entire global workforce to connect virtually and securely to the company’s enterprise software system, without which employees cannot accomplish their job. Thankfully, the shift was a success. Moving on, the UX team embarked on a massive redesign project of the current system.

We realized that designing for contextual change has never been as important. Together with the research team, we compiled a list of user research operations guides to help both researchers and designers carry out research mindfully while gathering grounded insights to inform the design and development direction of the project.


Device and Interface

We carried out a survey to understand the types of devices and interfaces used at home versus those used in the office. We found out that due to the lack of time and supply to ship hardware, employees were using their home devices such as laptop versus a desktop computer, with a plugged-in monitor, sometimes even a TV to double up as second monitor. Screen size, screen resolutions varied from those used at the office while intermittent internet and virtual desktop connectivity caused users to lose unsaved work. 

Being aware of all this, we optimized our designs and test prototypes, defined more robust user requirements and planned for browser compatibility testing.

Here’s a template of the User Device and Interface Survey we used, feel free to create a copy and use it.


Prototyping

When carrying out user testing we wanted to ensure that users experienced the best possible outcome of what the new system could look and feel like, despite the device and interface they used at the time. We discovered that Figma has a scaling setting which defaults to the user’s screen if the URL link to the prototype contains; &scaling=width  Here’s an article from Figma on setting prototype presentation view options.

Tip courtesy of Figma.

Tip courtesy of Figma.


Test tool and Recordings

Microsoft Teams meeting functions.

Microsoft Teams meeting functions.

When using tools or applications to carry out interviews or testing, try to avoid having participants  install or setup anything before the session. Ideally, use what the company already provides for video calls since users are already accustomed to handling such applications. In our case Microsoft Teams works well. It also allows for session recording, playbacks in Stream as well as full downloads. Make sure you have enough storage space for the GBs of recorded video.

If you don’t have Teams and need to use third party applications, make sure to provide clear visual instructions for participants along with the session invitation. 

Finally, use Airtable to manage results and findings or set up a table in Confluence with details and links to each recording.


Compassion

Last but not least, exercise compassion with participants.

Some people are camera shy especially, those relatively new to video calling technology. Allow participants to have their cameras turned off while asking them to think out loud at all times through the test session.    

Try to plan research around participants' work as well as personal availability and space. Remember their home office is also their partners’ shared space as well as their kids’ virtual classroom and pet play area. Finding a quiet space or time slot is something worth considering while planning and scheduling research sessions with participants. 

Stay_Well_Blog-BLOG-BANNER-1200x535.jpg
 

What else have you learnt and would like to share from carrying out research with working-from-home participants?

UX Planning Part II: The Playsheet

A framework and a template, to help you plan and update the UX activities for a given project.

The idea of working solo these days sounds productive until we get distracted from all things Covid and working from home. One of them is the ability to plan the next innovative project that will get us closer to the next normal life. This post provides you with some tangible UX Planning help. 

In Part I of this ‘UX Planning’ mini series, we covered ‘UX T-Shirt Sizing’; a relatively quick way to estimate the total time it would take to work on a type of project. In this second part, I’ll be presenting you with a framework which is also a template, called the UX Playsheet. The framework structures your thought process around the UX design and research activities needed to accomplish a project. The template part allows you to plot and estimate those activities, present them in a coherent manner and update the status as you move along the project.

Phases.png

Each pillar in the Playsheet represents a milestone within the user-centered design approach. Use this 5D Framework to help think the activities you need to meet each milestone;

  1. Discover - we have a good idea of the problem

  2. Definewe have a good idea of the desired outcome

  3. Designwe have a good idea of the solution

  4. Develop - we have built the solution

  5. Deliver - we have an idea of what to do next

activity+examples.jpg

Add the UX activities you think you need in the template. For example, to ‘have a good idea of the problem’, a few Discovery activities could include competitor review, user interviews, stakeholder interviews, competitor reviews etc.. Go through each milestone, think and add the relevant activities. Use the template to guide you. 

Next, add the estimate for each activity in days. The total should roughly tally with the original UX T-Shirt Size estimate. Later, and with the help of the Product or Project Manager, you could add the Sprints in which you will be working on the various activities.

Status legend.png

Initially as you plan, your sheet will be full of the same colored rectangles (yellow). Use the key legend component to change the status, keeping the Playsheet up to date.

Download the .fig template and import it into your Figma.

Peer review your plan by sharing your Figma project. Get feedback on what fellow designers think about the activities you chose given the type of project. Alternatively, you can create the same template in Miro or Mural. Similarly, allow your peers to review and collaborate, by creating or moving ‘cards’ (activities) into the various columns, i.e. phases of the project. Here’s an example of the UX Playsheet in Miro.

The Playsheet was found to be most valuable when presenting to Product Managers. UX Designers’ contribution towards the project and work effort was better understood as well as appreciated. As a result, planned UX activities were merged into the bigger project plan ahead of the project development sprints.

Additional Success Tips;

  • Walk the product and project manager/s through your UX Playsheet.

  • Gain agreement on the estimated days given the overall deadlines for project delivery. 

  • Adjust were needed; scale activities or days down or up accordingly, outlining any risks that you perceive. 

  • Share the Playsheet digitally with the other project team members.   

  • Update the Playsheet as you progress along the project and accommodate any deviations from the original plan.

  • Include the Playsheet with your deliverables example, in Freehand or Figma alongside your designs.

  • I recently discovered Miro’s Estimation App, which is primarily a Jira story estimation app however, it might be also used for UX planning and estimation based on the same principles of T-Shirt sizing. Check it out

Happy Planning!

Have questions, need more help? Get in touch! I also offer hourly based UX Strategy and DesignOps consultancy as needed.

UX Planning Part I: T-Shirt Sizing 

This article is intended to provide designers with a high level sizing scale to estimate the duration of a new project. 

Screen+Shot+2020-04-14+at+11.22.17.jpg

Never before Covid-19 did we need to adapt to change so quickly. Car manufacturers would perhaps need to prioritize voice recognition technology over the advancement of touchscreens, while car hygiene maintenance becomes equally important as safety driving. 

How can UX help product shift gears quickly? The key is planning. Nothing revolutionary, however, the shift here is for Product Managers to lean more on UX and not just engineering, to come up with thoughtful plans for each of the projects on the agenda, and fast. This article tackles the first planning technique which is deducing high level UX estimates. 

Assuming a list of projects have been ear-marked for potential business sustainability or even growth, the design lead or team can provide a time-based estimate into the duration required for one designer to fulfill the project from a UX perspective. We call this estimation, UX T-Shirt Sizing.  This estimate technique is based on what engineers have used to size projects from a technical perspective. 

Based on the project brief, as generally provided by the Product Manager and/or insights the team has obtained, the Design lead or team can start identifying the UX design and research activities the project could need.  Before we dive into the different types of sizing, let’s first understand the various types of projects. The majority of software as service (SaaS) product-related projects fall into four key types;  

  • enhancement/continuous improvement 

  • new feature/incremental functionality

  • refresh/redesign 

  • new service/design innovation. 

The following table shows the T-Shirt Size in calendar days (and equivalent sprint/s) for a designer working full time for each project type, based on anticipated UX design and research activities. Note: the tech effort and time estimates are included in this table. Those can be done separately so then both sets of Sizes are factored into the larger project timeline.  

Project Type UX Design and Research Activity Examples UX Calendar Days
(Sprint/s)
UX T-Shirt Size
Enhancement/Continuous Improvement
Fixes, single small features to the interface.
(Known Knowns)
  • Set UX KPIs
  • Wireframe/s based on existing templates
  • Copy editing or auditing
  • Review dev output
  • Usability testing
  • 1-5
    (half sprint)
    S
    New Feature/Incremental Functionality
    Either a MVP of a simple service, or adding
    complex processes/features to an existing service.
    (Known Knowns, some Unknowns)
  • Competitive Research
  • Sitemap and/or User Journey
  • Copy editing or auditing
  • Set UX KPIs
  • Wireframes
  • Prototype
  • Usability testing
  • Copy editing or audit
  • Design reviews and iterations
  • 5-10
    (1 sprint)
    M
    Refresh/Redesign
    Version one of a complex service, or any
    full number incremental changes or a major UX improvement.
    (Known Unknowns)
    Consider a Design Sprint, in which case
    add another 5 days.
  • Explorative research
  • Competitive reserach
  • Concept testing
  • Set UX KPIs
  • User flow diagrams
  • Personas
  • Wireframes
  • Prototype
  • Usability testing
  • Copy editing or auditing
  • Design reviews and iterations
  • ~20
    (2 sprints)
    L
    New Service/Design Innovation
    Radical new product or concept. Version one, or any
    increment where innovation is a big factor.
    (Unknown Unknowns)
    Consider a Problem Framing workshop followed
    by a Design Sprint, in which case add 6 days.
  • Generative research
  • Stakeholder interviews
  • Contextual inquiry
  • Competitive research
  • Personas
  • User Journeys
  • Wireframes
  • Prototype
  • Usability testing
  • Copy editing or audit
  • Design reviews and iterations
  • ~40
    (4 sprints)
    XL

    The UX T-Shirt Sizing in the table above, is based on a number of past projects of a particular enterprise company. Feel free to adjust the list of UX activities and sizes, depending on your current design practice, team capacity and the rate of change in your organization.  

    The result is a unified list with both UX and Developer teams’ estimates per project (see example below). This provides product management with substantial information to help decide on the overall order in which projects will be tackled based magnitude.

    Screen+Shot+2020-04-14+at+17.02.27.jpg

    In the next blog we’ll tackle UX Planning Part II - The Play Sheet, a template UX Designers can use to produce a more accurate list of UX activities and time estimates per project. 

    Have questions, need more help? Get in touch! I offer hourly based UX Strategy and DesignOps consultancy as needed.